The best sales teams use data but often face a common issue: tracking too much information can lead to analysis paralysis. More data isn’t always better. Monitoring every action can bog teams down, hindering their ability to sell. Instead of clarity, too many numbers can slow progress. So, focusing on key sales metrics that match your company’s goals to drive performance. Read on to learn more.
What Are KPIs in Sales?
Key performance indicators (KPIs) in sales are metrics to see how well a sales team is hitting its goals. These KPIs show team performance and their impact on the business. Common metrics include the average number of quarterly leads and the deal conversion rate. Focusing on these metrics helps sales teams align their strategies with company goals, improve processes, and drive growth and long-term business success.
Sales Metrics vs. Sales KPIs
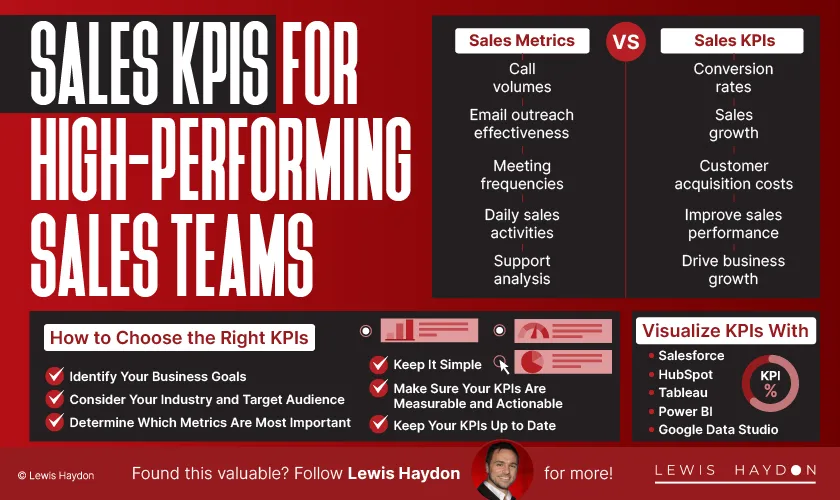
Sales metrics are data points that track parts of the sales process, offering insights into operations like call volumes, email outreach effectiveness, and meeting frequencies. They give a snapshot of daily sales activities and support analysis. Understanding how to improve sales skills helps sales teams interpret these metrics more effectively, turning data into actionable strategies that enhance performance and drive better results.
On the other hand, KPIs for sales are specific metrics tied to business goals. KPIs assess how well sales efforts meet targets like conversion rates, sales growth, and customer acquisition costs. Unlike general metrics, KPIs guide decision-making and planning to improve sales performance and drive business growth.
Why Are Sales KPIs So Important?
Without tracking sales KPI, sales reps and leaders are flying blind, not knowing if their actions are hitting the mark. This lack of insight makes future sales predictions a shot in the dark and makes it hard to guide teams strategically. The sales world is always changing, so teams need to watch their KPIs and change with the times. When goals shift, KPIs for sales teams should be checked to match the new targets. Regularly reviewing these metrics helps sales leaders and their teams sharpen their strategies, focus on what matters, and achieve great results. Hitting sales targets is key for any organization’s success, and tracking the right KPIs keeps sales teams on track.
How to Choose the Right KPIs
To make things easier for you, here are the top sales KPIs to track:
Identify Your Business Goals
The first step in choosing the right KPIs is to clearly define your business goals. Are you looking to increase sales, improve customer satisfaction, or streamline operations? Once you know what you’re aiming for, select KPIs that track your progress. If your goal is to increase sales, focus on KPIs like revenue growth, conversion rate, or average order value. For improving customer satisfaction, pay attention to metrics like customer loyalty, retention rate, or Net Promoter Score (NPS). By aligning KPIs with your goals, you get valuable insights to make informed decisions. To help you out, we’ve put together a comprehensive online library of KPI examples organized by department and industry.
Consider Your Industry and Target Audience
Different industries and audiences need specific KPIs. For instance, a retail business might focus on sales and customer satisfaction, while a manufacturing company might look at production efficiency and cost reduction. Choose KPIs that match your industry and audience. In the B2B software sector, consider customer acquisition cost, customer lifetime value, or churn rate. In B2C e-commerce, metrics like website traffic, conversion rate, or average order value could be more relevant. Align KPIs with your industry and audience to understand your business’s performance and spot areas for improvement.
Determine Which Metrics Are Most Important
Not all metrics drive your business forward equally; some impact it more. When picking KPIs, choose those that align best with your goals. Small business owners might focus on profit margin, cash flow, and ROI. Startups may prioritize growth metrics like customer acquisition, monthly recurring revenue, or user growth. Identify the most important metrics to streamline efforts and make the best use of your time and resources.
Keep It Simple
While it might be tempting to track too many KPIs, it’s smart to focus on a few key metrics. Tracking too many can lead to confusion and inaction. Stick to metrics that align with your business goals and provide useful insights. For a small business, track 3-5 important metrics, like revenue growth, customer satisfaction, and profitability. This makes it easier to track progress and spot areas for improvement.
Make Sure Your KPIs Are Measurable and Actionable
KPIs should be measurable, trackable, and actionable. They need to indicate steps to improve performance. Choose KPIs that identify issues and suggest solutions. For instance, if revenue growth is a KPI, track lead generation, conversion rate, and average order value. These numbers can reveal areas for improvement and help drive revenue growth. If customer satisfaction is a KPI, keep an eye on response time, resolution rate, and customer feedback to find areas to improve.
Keep Your KPIs Up to Date
As business goals shift, it’s important to review and update your KPIs regularly. Make sure they stay aligned with your current objectives and provide useful insights. For instance, a startup that initially focuses on growing its user base might shift to increasing revenue once it has more users. In this case, KPIs should adjust to focus on revenue growth, customer acquisition cost (CAC), and customer lifetime value (CLV).

20 Sales KPIs for High-Performing Sales Teams
Using the right sales KPIs is key to building a strong sales team that consistently hits business targets.
1. Sales Opportunities
This KPI tracks the sales opportunities generated by your reps, serving as a tool for forecasting future sales and identifying which opportunities are worth pursuing. Spotting and acting on these opportunities is important for the success of your sales team. Tracking this KPI gives you insights into your sales process, helping you evaluate the effectiveness of your outreach. You can determine if you’re targeting the right audience and if your sales pitch connects with potential clients. This assessment is important for tweaking current strategies and shaping future tactics.
2. Monthly Sales Growth
Monthly sales growth measures how your sales revenue changes from one month to the next, showing increases or decreases. This KPI reflects your business’s health—without growth, sustainability can be tricky. Tracking monthly sales growth offers insights to refine sales tactics, adjust strategies, and rethink product focus. By tracking this metric, you can understand your sales initiatives better and make data-driven changes to support business growth.
3. Monthly Calls or Emails Per Sales Rep
Managers and team leaders need to understand what their sales reps are doing each day to assess productivity. Track the monthly number of sales calls, emails, or other outreach methods by each rep to measure activity. This KPI highlights individual productivity and engagement. Monitoring these metrics helps identify top performers, enabling better resource allocation and strategy adjustments for improved sales team performance.
4. Number of Monthly Onboarding and Demo Calls
For companies using demos and trials in their sales strategy, tracking the monthly number of onboarding and demo calls is important. This KPI helps assess how well your sales funnel works and shows the success rates of sales reps. Monitoring potential customers through demo and trial phases gives businesses insights into customer engagement and areas for improvement. These insights help teams sharpen their sales strategies, increase conversion rates, and improve the team’s performance. This metric also shows the effectiveness of sales reps, revealing who might need extra support or training to close more deals.
5. Monthly Sales Bookings
Monthly sales bookings are a key KPI that tracks the value of sales over a specific period. Tech companies often use this metric to measure the monetary value of their monthly sales successes. Reviewing monthly sales bookings gives sales leaders a clear view of team performance and alignment with business goals. This KPI also helps shape the wider sales strategy, leading to more accurate sales forecasts. Recognizing trends in sales bookings lets decision-makers tweak tactics and allocate resources effectively, supporting growth and adaptability.
6. Sales Per Rep
The effectiveness of your sales team is linked to the skills and performance of individual sales representatives. It’s important to identify top performers and those who could use extra coaching. Sales per rep is a key metric that highlights standout performers. This helps recognize talent and spot areas for improvement. Measuring sales per person can create friendly competition, motivating everyone to improve. This KPI offers insights into individual contributions, helping leaders allocate training resources wisely and improve team productivity.
7. Average New Deal Size/Length
Monitoring the average new deal size and deal length gives clear insights into your sales and product performance. Checking the value of new deals and how long they take to close helps pinpoint which products need more attention and resources. This metric also helps evaluate sales reps. A rep closing many deals might seem to outperform another with fewer deals. But looking at the new deal size might show the second rep adds more revenue with bigger deals. This analysis helps accurately assess each sales rep’s impact, helping managers make smart decisions about coaching, resources, and planning.
8. Sales by Contact Method
With many ways to reach clients and sell, knowing which methods lead to success is key. Tracking sales back to initial contact methods reveals the best tools for customer engagement and closing deals. Analyzing sales by contact method helps identify what works. If many sales come from in-person visits, it shows face-to-face is important in your strategy. This KPI also highlights training opportunities, helping your team become skilled in specific contact methods. Paired with individual sales rep metrics, it provides insights into who excels where, whether on calls or in meetings.
9. Quote-To-Close Ratio
The quote-to-close ratio measures how well quotes turn into closed deals. It shows your sales team’s effectiveness at the quoting stage. Track this ratio to see how they stack up against past performance. For example, if a rep sends 100 quotes in a month and closes 45 deals, their rate is 45%. A low ratio might hint at pricing issues or how your product is presented. Identifying and fixing these can improve conversion rates and sales performance.
10. Average Sales Cycle Length
The average sales cycle length tracks the time from first contact to deal closure. This metric checks the efficiency of your sales process, showing if you’re hitting benchmarks to streamline operations and cut out waste. Sales managers can spot which team members close deals quickly and who might need extra help or training. Context matters; if a rep has a longer cycle but lands big deals, a longer average could still meet business goals. Watching this KPI helps make smart adjustments, ensuring resources are used well for better productivity. Plus, who doesn’t love a good sales joke? “Why did the sales rep bring a ladder? To close higher deals!”
11. Lead-to-Sale %
The lead-to-sale percentage, often called the lead conversion rate, is used to track how many leads become paying customers. This figure helps assess your team’s skill in turning prospects into clients. By comparing results across marketing channels, businesses can see which ones bring in the best conversions. Sales managers use this to check the effectiveness of their conversion processes and the health of their sales pipeline. Spotting strengths and weaknesses in this funnel helps refine strategies, optimize resources, and increase revenue.
12. Average Conversion Time
Average conversion time is one of the metrics used to measure the duration to turn a lead into a sale. It’s a key metric for sales managers to assess the speed of their sales funnel. A long conversion time might indicate inefficiencies in sales techniques. But, don’t look at this metric alone—sales reps dealing with complex deals often have longer conversion times due to the detailed attention required. High-value products also take longer to sell, as people and businesses are cautious with big financial decisions. So, understanding context is important for interpreting this metric and adjusting sales strategies.
13. Average Profit Margin
The average profit margin is a key metric showing how much of your revenue becomes profit, giving insight into your sales profitability. It helps sales teams decide which products to focus on and upsell. Watching profit margins allows companies to check if their pricing is competitive, ensuring goods and services align with the market. Setting the right prices means balancing demand with profit goals, requiring feedback from sales teams to find levels that appeal to customers while keeping profits healthy.
14. Average Purchase Value
The average purchase value, an important sales metric, shows how much each customer spends on your products and services. This KPI reveals how well upselling is working and how your offerings perform in the market. Analyzing average purchase value helps sales teams see how successful they are at getting customers to spend more. This metric helps shape strategies to increase average revenue by spotting chances for upselling and cross
15. Customer Acquisition Cost
The customer acquisition cost (CAC) measures how much it costs to gain a new customer. This includes costs like sales team salaries, marketing, and social media campaigns. Knowing your CAC helps you see how well your acquisition strategies are working. It can differ a lot based on the industry and the product or service. Analyzing CAC gives businesses a clear view of the financial effort needed to grow their customer base and adjust strategies for sustainable growth and profitability.
16. Retention and Churn Rates
Retention rate measures the percentage of customers who stick with your company over time, while churn rate shows those who stop using your services. Keeping an eye on these metrics helps gauge your sales team’s ability to maintain customer loyalty. High retention rates lead to more upsell opportunities than chasing new customers. Watching retention and churn rates lets you assess customer satisfaction and find ways to improve their experience, which can boost profits and reduce customer loss.
17. Customer Lifetime Value
Customer lifetime value (CLV) is one of the most used KPIs to measure the total sales revenue a business can expect from a customer over their entire association with the company. This metric helps identify which customer segments are the most profitable. Analyzing CLV helps sales teams focus on clients who contribute most to long-term revenue. CLV also gives insight into your sales team’s ability to consistently engage and sell to customers. The goal is to increase each cyour sales team is managing customer relationshipsustomer’s lifetime value, as a higher CLV means more revenue from each client. A declining CLV means it’s time to rethink how customer relationships are being managed by your sales team.
18. New and Expansion MRR
Understanding monthly recurring revenue (MRR) is key for SaaS companies. Calculate MRR by multiplying the number of paying customers by their average payment. MRR comes from New MRR, the extra revenue from new customers or lower acquisition costs, and Expansion MRR, from existing customers upgrading or buying more. These metrics help sales teams evaluate their strategies. If a new strategy leads to an MRR drop, it’s time to investigate. Keeping track of MRR helps make smart decisions for business growth and sustainability.
19. Average Cost Per Lead
Calculating your cost per lead helps determine a marketing campaign’s profitability. If it’s high, rethink your pricing strategies, product promotions, as well as the sales and marketing channels. Pairing cost per lead with average deal size shows which channels attract high-value customers. This analysis helps you allocate resources wisely to improve return on investment and marketing effectiveness.
20. Product Performance
Understanding product performance helps identify best-selling items and those not meeting expectations. This KPI reveals customer preferences and shows which products connect with your audience. Remember, high sales volume doesn’t always mean high revenue. A frequently sold product might be cheap or priced low to attract customers, thus contributing little to total revenue. Sales leaders can use this metric to analyze market dynamics and decide on retiring underperforming products. This approach better aligns with customer demands and boosts overall profitability.
How to Track Important Sales KPIs Effectively
Tracking key sales metrics is important for making smart business decisions and refining sales strategies.
Keep Your Data Clean
Clean sales data helps track KPIs accurately. Regularly audit your database to remove duplicates and outdated information, and keep data entry consistent. This boosts KPI reliability and supports smart decision-making.
Set Sales Benchmarks
Setting sales benchmarks lets you measure performance against standards. By setting realistic targets, you can track progress and spot improvement areas. This aligns your team’s efforts with sales goals, driving growth and productivity.
Use the Right Tools to Track Essential KPIs
Using the right tools is key for tracking sales KPIs. Utilize CRM systems and analytics platforms to monitor metrics like conversion rates and sales cycles. These tools offer real-time insights, helping you make informed decisions and improve sales strategies.
Define KPIs for Each Stage of the Funnel
Defining KPIs for each sales funnel stage brings clarity. From lead generation to closing deals, track performance metrics. This approach helps pinpoint issues, optimize processes, and ensure a smooth flow through the funnel.
Customers Aren’t Numbers
While KPIs matter, customers aren’t just numbers. Build relationships by understanding their needs and delivering great experiences. Prioritize customer satisfaction and feedback, as these insights can be as valuable as the numbers in driving sales success.
FAQs
How often should KPIs be reviewed?
Review sales KPIs regularly to ensure they match business goals and market conditions. Monthly reviews work well for timely tweaks and planning. The frequency can change based on industry dynamics and metric shifts. Weekly or bi-weekly checks help track performance and make quick corrections. The aim is to create a review schedule that supports decision-making and improves sales results.
What tools help visualize sales KPIs?
Tools can help visualize sales KPIs, turning data into insights. CRM systems like Salesforce and HubSpot have dashboards that track sales metrics. BI platforms such as Tableau and Power BI offer analytics for data visualization and interactive reports. Google Data Studio creates shareable reports for real-time performance. Choose your tool based on needs, budget, and data complexity.
How do KPIs drive sales team motivation?
Key Performance Indicators (KPIs) motivate sales teams by providing clear targets and measurable goals that align with the organization's vision. When sales teams know what's expected and can track their progress with KPIs, they're more likely to stay engaged and focused on hitting their goals. This clarity encourages a playful competitiveness, pushing team members to beat their past records. Recognizing and rewarding those who meet or exceed KPI targets can improve morale. Linking KPIs with pay, career growth, and personal development creates a clear path for success, motivating sales teams to give their best consistently.
What common mistakes to avoid with KPIs?
Using KPIs comes with common pitfalls. Setting too many metrics can overwhelm teams and dilute focus. Prioritize a few KPIs that align with goals instead of tracking every metric. Failing to update KPIs with changing business environments can lead to outdated data steering decisions. Ignoring qualitative metrics like customer satisfaction or employee engagement can give a narrow view of performance. Finally, poor communication of KPI results can hinder informed actions. Make sure insights from KPIs are shared clearly and promptly.